Grid2Op Plotting capabilities (beta)
This page is organized as follow:
Objectives
This module contrains all the plotting utilities of grid2op. These utilities can be used in different manners to serve different purposes:
PlotMatplotallows a more in depth study, with a better overall layout. It uses the well-known matplotlib library to represent the powergrid on the screen.PlotPlotlyuses plotly library to represent the graph. As opposed to the others, plotly allows dynamic modifications such as zoom in / out. This makes this class particularly suited for in depth study of some powergrid state.
The class PlotMatplot is also used by EpisodeReplay that allows to look at the action taken by
the agent pretty easily, and allows easy saving into gif format (see below for more information)
import os
import warnings
import grid2op
from grid2op.Episode import EpisodeReplay
from grid2op.Agent import GreedyAgent, RandomAgent
from grid2op.Runner import Runner
from tqdm import tqdm

path_agents = "agent_pseudo_random"
with warnings.catch_warnings():
    warnings.filterwarnings("ignore")
    env = grid2op.make("l2rpn_case14_sandbox")

class CustomRandom(RandomAgent):
    """
    This agent takes 1 random action every 10 time steps.
    """
    def __init__(self, action_space):
        RandomAgent.__init__(self, action_space)
        self.i = 0

    def my_act(self, transformed_observation, reward, done=False):
        if self.i % 10 != 0:
            res = 0
        else:
            res = self.action_space.sample()
        self.i += 1
        return res

# execute this agent on 1 scenario, saving the results
runner = Runner(**env.get_params_for_runner(), agentClass=CustomRandom)
path_agent = os.path.join(path_agents, "RandomAgent")
res = runner.run(nb_episode=1, path_save=path_agent, pbar=tqdm, agent_seeds=[0])
# and now reload it and display the "movie" of this scenario
plot_epi = EpisodeReplay(path_agent)
plot_epi.replay_episode(res[0][1], gif_name="episode")
An possible output will look like this:
Render the state of the grid
During the gymnasium loop
In Grid2Op we also made available the possibility to render the state of the grid that your agent sees before taking an action. This can be done with the provided environments following gymnasium interface like this:
import grid2op
from grid2op.Agent import RandomAgent
from grid2op.Episode import EpisodeReplay

env = grid2op.make("l2rpn_case14_sandbox")
agent = RandomAgent(env.action_space)
nb_episode = 1
for i in range(nb_episode):
    obs = env.reset()
    done = False
    reward = env.reward_range[0]
    while not done:
        _ = env.render()
        act = agent.act(obs, reward, done)
        obs, reward, done, info = env.step(act)
NB we don’t recommend to use the renderer during the training of an Agent as it might slow down the training significantly.
Offline, after the scenarios were played
In Grid2Op, you can execute a Runner to perform the “gymnasium loops” and store the results in a standardized manner. Once stored, the results can be loaded back and “replayed” using the appropriate class. Here is how you can do this:
import grid2op
from grid2op.Agent import RandomAgent
from grid2op.Runner import Runner
from grid2op.Episode import EpisodeReplay

path_saved_data = "where_i_want_to_save_it"
# create an environment and an agent
env = grid2op.make("l2rpn_case14_sandbox")
agent = RandomAgent(env.action_space)

# create a runner
runner = Runner(**env.get_params_for_runner(), agentClass=None, agentInstance=agent)

# run and save the results
res = runner.run(nb_episode=1, path_save=path_saved_data)

# and now load it and play the "movie"
plot_epi = EpisodeReplay(path_saved_data)
plot_epi.replay_episode(res[0][1], gif_name="this_episode.gif")

# and in `os.path.join(path_saved_data, res[0][1])` (or example "where_i_want_to_save_it/000")
# a file named "this_episode.gif" has been created
Plot a given observation
We also included some module to plot a given observation that can be customize depending on what you want to plot.
You can use them as follow:
import grid2op
from grid2op.PlotGrid import PlotMatplot
env = grid2op.make("l2rpn_case14_sandbox")
plot_helper = PlotMatplot(env.observation_space)
obs = env.reset()
# if you want to plot all the observation
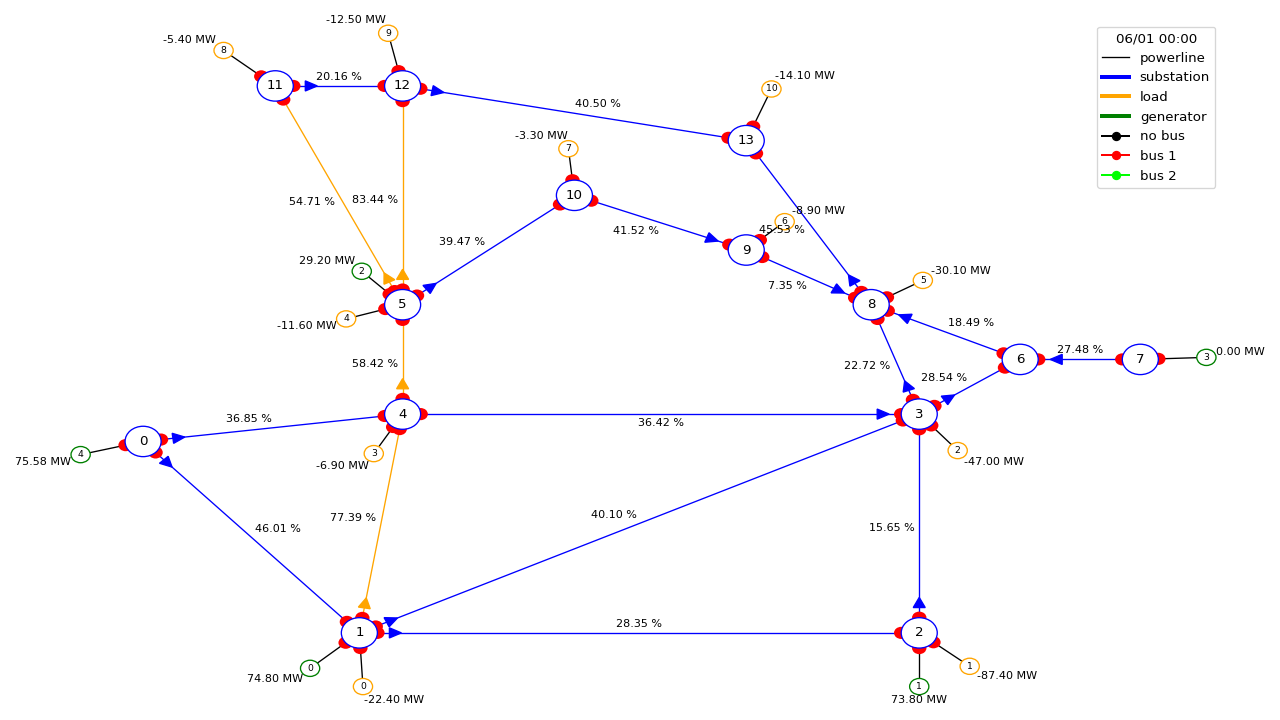
fig = plot_helper.plot_obs(obs)
fig.show()
# you can also chose what to plot for each "object type"
fig_custom = plot_helper.plot_obs(obs
line_info="rho",
load_info=None, # i don't plot anything concerning the load
gen_info="v" # i draw the voltage setpoint of the generators
)
fig_custom.show()
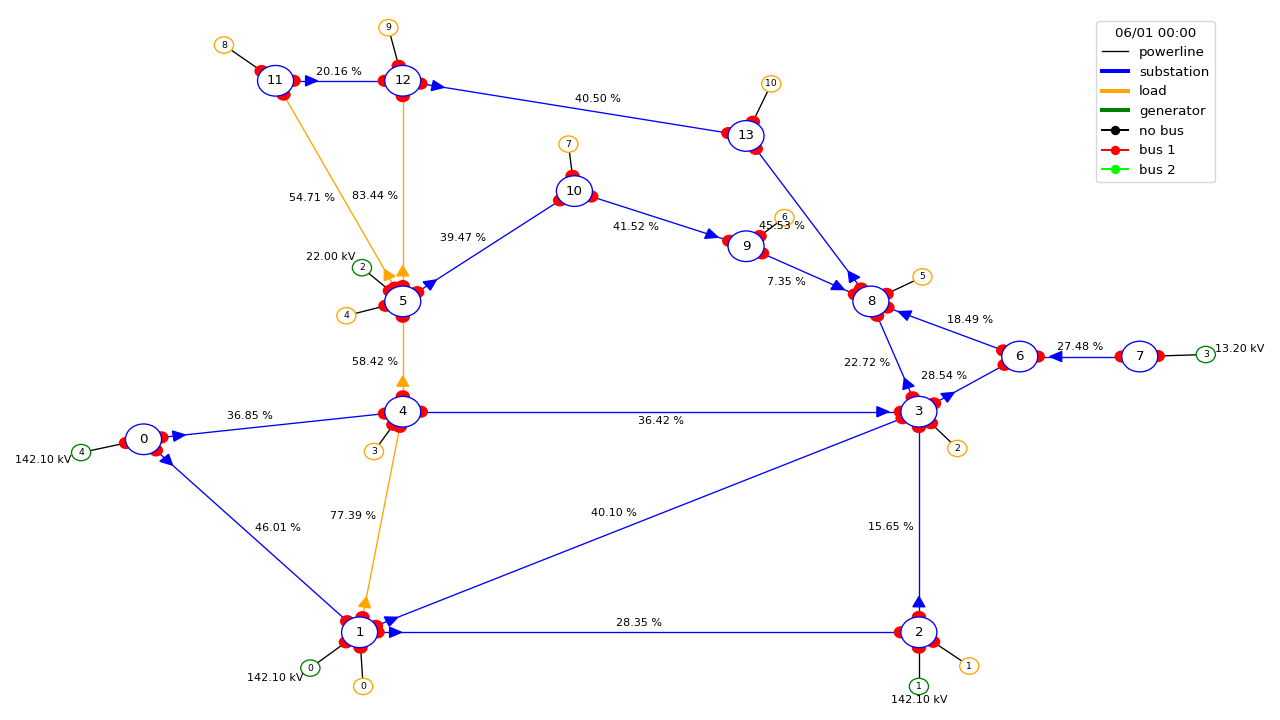
See definition of BasePlot.plot_obs() for more information. The results of the above code is:
And the second image is
Plot data on the grid
For convenience, we also included a set of function that are able to plot some custom information and
“project” them into the graph of the grid. This can be interesting if you want to represent some properties
of the objects on the grid. The function showed here accept anything that can be converted to float that
have the same size of the number of objects (for example if you want to display something on the powerlines
you need this “something” to be vector that counts as many elements as the number of powerlines in the
powergrid).
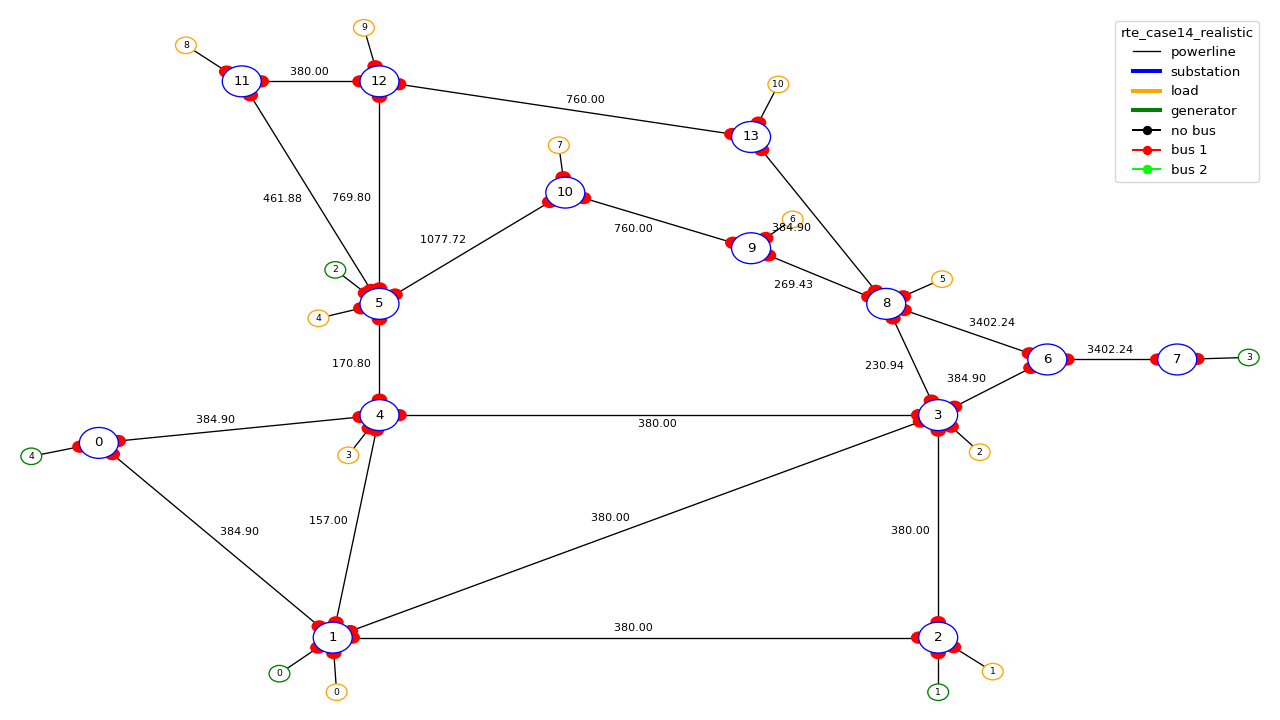
In the example bellow, we plot the thermal limits (maximum current allowed on a powerline) of the each powerline:
import grid2op
from grid2op.PlotGrid import PlotMatplot

env = grid2op.make("l2rpn_case14_sandbox")
plot_helper = PlotMatplot(env.observation_space)

# plot the thermal limits of each powerlines
fig_info = plot_helper.plot_info(line_values=env.get_thermal_limit())
fig_info.show()
The above code will output this image
Of course you can also “project” on the grid all kind of variable and also for generators and loads, for example with
import grid2op
from grid2op.PlotGrid import PlotMatplot

env = grid2op.make("l2rpn_case14_sandbox")
plot_helper = PlotMatplot(env.observation_space)

# plot the thermal limits of each powerlines and the voltages magnitude of each load
fig_info = plot_helper.plot_info(line_values=env.get_thermal_limit(), load_values=obs.load_v)
fig_info.show()

# plot only the generator pmax
fig_info2 = plot_helper.plot_info(gen_values=env.gen_pmax)
fig_info2.show()
More information is available in the description of the function BasePlot.plot_info().
Detailed Documentation by class
Classes:
|
INTERNAL |
- class grid2op.PlotGrid.BasePlot(observation_space, width=800, height=600, scale=2000.0, grid_layout=None, parallel_spacing=3.0)[source]
INTERNAL
Warning
/!\ Internal, do not use unless you know what you are doing /!\
Abstract interface to plot the state of the powergrid
Implement the interface with a plotting library to generate drawings
- observation_space
The observation space used.
- Type:
grid2op.Observation.ObservationSpace
- width
- Type:
intWidth of the drawing
- height
- Type:
intHeight of the drawing
- grid_layout
- Type:
dictA grid layout dict to use
Methods:
__init__(observation_space[, width, height, ...])_aux_draw_elements(figure, observation, ...)generic method to loop through all elements of a given type and call the draw function on them
clear_figure(figure)Clears a figure Depending on the library can also be called Plot, canvas, screen ..
compute_grid_layout(observation_space[, ...])Compute the grid layout from the observation space
convert_figure_to_numpy_HWC(figure)Given a figure as returned by BasePlot.create_figure Convert it to a numpy array of dtype uint8 and data layed out in the HWC format
create_figure()Creates a new figure to draw into.
draw_gen(figure, observation, gen_name, ...)Draws a generator into the figure
draw_legend(figure, observation)Setup the legend for the given figure.
draw_load(figure, observation, load_name, ...)Draws a load into the figure
draw_powerline(figure, observation, line_id, ...)Draws a powerline into the figure
draw_storage(figure, observation, ...)Draws a storage unit into the figure
draw_substation(figure, observation, sub_id, ...)Draws a substation into the figure
plot_info([figure, redraw, line_values, ...])Plot an observation with custom values
plot_layout()This function plot the layout of the grid, as well as the object.
plot_obs(observation[, figure, redraw, ...])Plot an observation.
plot_postprocess(figure, observation, is_update)Some implementations may need post-processing.
update_gen(figure, observation, gen_name, ...)INTERNAL
update_legend(figure, observation)INTERNAL
update_load(figure, observation, load_name, ...)INTERNAL
update_powerline(figure, observation, ...)INTERNAL
update_storage(figure, observation, ...)INTERNAL
update_substation(figure, observation, ...)INTERNAL
Attributes:
__weakref__list of weak references to the object (if defined)
- __init__(observation_space, width=800, height=600, scale=2000.0, grid_layout=None, parallel_spacing=3.0)[source]
- __weakref__
list of weak references to the object (if defined)
- _aux_draw_elements(figure, observation, load_values, load_unit, draw_fn, el_names, el_to_subid, el_pos_topo_vect)[source]
generic method to loop through all elements of a given type and call the draw function on them
- abstractmethod clear_figure(figure)[source]
Clears a figure Depending on the library can also be called Plot, canvas, screen ..
- compute_grid_layout(observation_space, grid_layout=None)[source]
Compute the grid layout from the observation space
This should return a native python
dictin the same format as observation_space.grid_layout :{ "substation1_name": [x_coord, y_coord], "substation2_name": [x_coord, y_coord], [...], "load1_name": [x_coord, y_coord], [...], "gen1_name": [x_coord, y_coord], [...] }
Note that is must contain at least the positions for the substations. The loads and generators will be skipped if missing.
By default, if grid_layout is provided this is returned, otherwise returns observation_space.grid_layout
- Parameters:
observation_space (
grid2op.Observation.ObservationSpace) – The observation space of the environmentgrid_layout (
dictorNone) – A dictionary containing the coordinates for each substation.
- abstractmethod convert_figure_to_numpy_HWC(figure)[source]
Given a figure as returned by BasePlot.create_figure Convert it to a numpy array of dtype uint8 and data layed out in the HWC format
- abstractmethod create_figure()[source]
Creates a new figure to draw into. Depending on the library can also be called Plot, canvas, screen ..
- abstractmethod draw_gen(figure, observation, gen_name, gen_id, gen_bus, gen_value, gen_unit, pos_x, pos_y, sub_x, sub_y)[source]
Draws a generator into the figure
- Parameters:
figure –
create_figure (This is the object returned by) –
observation (grid2op.Observation.BaseObservation) –
drawn (Current state of the grid being) –
gen_name (
strName of the load) –gen_id (
intId of the generator, Index in the observation) –gen_bus (
intBus id the generator is connected to) –gen_value (
float) –state (An informative value of the generator current) –
gen_unit (
strThe unit of the gen_value argument as a string) –pos_x (
intx position from the layout) –pos_y (
inty position from the layout) –sub_x (
intx position of the connected substation from the layout) –sub_y (
inty position of the connected substation from the layout) –
- abstractmethod draw_legend(figure, observation)[source]
Setup the legend for the given figure.
- Parameters:
figure (
objectFigure to draw to.) –create_figure (This is the object returned by) –
observation (
grid2op.Observation.BaseObservation) –drawn (Current state of the grid being) –
- abstractmethod draw_load(figure, observation, load_name, load_id, load_bus, load_value, load_unit, pos_x, pos_y, sub_x, sub_y)[source]
Draws a load into the figure
- Parameters:
figure –
create_figure (This is the object returned by) –
observation –
drawn (Current state of the grid being) –
load_name (
strName of the load) –load_id (
intId of the load, Index in the observation) –load_bus (
intId of bus the load is connected to.) –load_value (
floatAn informative value of the load current state) –load_unit (
strThe unit of the load_value argument as a string) –pos_x (
intx position from the layout) –pos_y (
inty position from the layout) –sub_x (
intx position of the connected substation from the layout) –sub_y (
inty position of the connected substation from the layout) –
- abstractmethod draw_powerline(figure, observation, line_id, line_name, connected, line_value, line_unit, or_bus, pos_or_x, pos_or_y, ex_bus, pos_ex_x, pos_ex_y)[source]
Draws a powerline into the figure
- Parameters:
figure (
objectFigure to draw to.) –create_figure (This is the object returned by) –
observation (
grid2op.Observation.BaseObservation) –drawn (Current state of the grid being) –
line_id (
intId of the powerline, index in the observation) –line_name (
strName of the powerline) –connected (
boolIs the line connected ?) –line_value (
floatAn informative value of the line current state) –line_unit (
strThe unit of the line_value argument as a string) –or_bus (
intBus the powerline origin is connected to) –pos_or_x (
intPowerline origin x position from the layout) –pos_or_y (
intPowerline origin y position from the layout) –ex_bus (
intBus the powerline extremity is connected to) –pos_ex_x (
intPowerline extremity x position from the layout) –pos_ex_y (
intPowerline extremity y position from the layout) –
- abstractmethod draw_storage(figure, observation, storage_name, storage_id, storage_bus, storage_value, storage_unit, pos_x, pos_y, sub_x, sub_y)[source]
Draws a storage unit into the figure
- Parameters:
figure –
create_figure (This is the object returned by) –
observation –
drawn (Current state of the grid being) –
storage_name (
strName of the load) –storage_id (
intId of the load, Index in the observation) –storage_bus (
intId of bus the load is connected to.) –storage_value (
floatAn informative value of the load current state) –storage_unit (
strThe unit of the load_value argument as a string) –pos_x (
intx position from the layout) –pos_y (
inty position from the layout) –sub_x (
intx position of the connected substation from the layout) –sub_y (
inty position of the connected substation from the layout) –
- abstractmethod draw_substation(figure, observation, sub_id, sub_name, pos_x, pos_y)[source]
Draws a substation into the figure
- Parameters:
figure –
create_figure (This is the object returned by) –
observation –
drawn (Current state of the grid being) –
sub_id –
sub_name –
pos_x –
pos_y –
- plot_info(figure=None, redraw=True, line_values=None, line_unit='', load_values=None, load_unit='', storage_values=None, storage_unit='', gen_values=None, gen_unit='', observation=None, coloring=None)[source]
Plot an observation with custom values
- Parameters:
figure (
object) – The figure on which to plot the observation. If figure isNonea new figure is created.line_values (
list) – information to be displayed for the powerlines [must have the same size as observation.n_line and convertible to float]line_unit (
str) – Unit string for the :line_values: argument, displayed after the line valueload_values (
list) – information to display for the loads [must have the same size as observation.n_load and convertible to float]load_unit (
str) – Unit string for the :load_values: argument, displayed after the load valuestorage_values (
list) – information to display for the storage units [must have the same size as observation.n_storage and convertible to float]storage_unit (
str) – Unit string for the :storage_values: argument, displayed after the storage valuegen_values (
list) – information to display in the generators [must have the same size as observation.n_gen and convertible to float]gen_unit (
str) – Unit string for the :gen_values: argument, displayed after the generator valueobservation (
grid2op.Observation.BaseObservation) – An observation to plot, can be None if no values are drawn from the observationcoloring –
Nonefor no special coloring, or “line” to color the powerline based on the value (“gen” and “load” coming soon)
Examples
More examples on how to use this function is given in the “8_PlottingCapabilities.ipynb” notebook.
The basic concept is:
import grid2op
from grid2op.PlotGrid import PlotMatplot
env = grid2op.make("l2rpn_case14_sandbox")
plot_helper = PlotMatplot(env.observation_space)

# plot the layout (position of each elements) of the powergrid
plot_helper.plot_layout()

# project some data on the grid
line_values = env.get_thermal_limit()
plot_helper.plot_info(line_values=line_values)

# to plot an observation
obs = env.reset()
plot_helper.plot_obs(obs)
- Returns:
res – The figure updated with the data from the new observation.
- Return type:
object
- plot_layout()[source]
This function plot the layout of the grid, as well as the object. You will see the name of each elements and their id.
- plot_obs(observation, figure=None, redraw=True, line_info='rho', load_info='p', gen_info='p', storage_info='p')[source]
Plot an observation.
- Parameters:
observation (
grid2op.Observation.BaseObservation) – The observation to plotfigure (
object) – The figure on which to plot the observation. If figure isNone, a new figure is created.line_info (
str) – One of “rho”, “a”, or “p” or “v” The information that will be plotted on the powerline. By default “rho”. All flow are taken “origin” side.load_info (
str) – One of “p” or “v” the information displayed on the load. (default to “p”).gen_info (
str) – One of “p” or “v” the information displayed on the generators (default to “p”).storage_info (
str) – One of “p” or None the information displayed on the generators (default to “p”).
- Returns:
res – The figure updated with the data from the new observation.
- Return type:
object
- plot_postprocess(figure, observation, is_update)[source]
Some implementations may need post-processing. This is called at the end of plot.
- update_gen(figure, observation, gen_name, gen_id, gen_bus, gen_value, gen_unit, pos_x, pos_y, sub_x, sub_y)[source]
INTERNAL
Warning
/!\ Internal, do not use unless you know what you are doing /!\
Updates a generator into the figure
- update_legend(figure, observation)[source]
INTERNAL
Warning
/!\ Internal, do not use unless you know what you are doing /!\
Updates the legend for the given figure.
- update_load(figure, observation, load_name, load_id, load_bus, load_value, load_unit, pos_x, pos_y, sub_x, sub_y)[source]
INTERNAL
Warning
/!\ Internal, do not use unless you know what you are doing /!\
Update a load into the figure
- update_powerline(figure, observation, line_id, line_name, connected, line_value, line_unit, or_bus, pos_or_x, pos_or_y, ex_bus, pos_ex_x, pos_ex_y)[source]
INTERNAL
Warning
/!\ Internal, do not use unless you know what you are doing /!\
Draws a powerline into the figure
If you still can’t find what you’re looking for, try in one of the following pages:
Still trouble finding the information ? Do not hesitate to send a github issue about the documentation at this link: Documentation issue template
Copyright © Grid2Op a Series of LF Projects, LLC For website terms of use, trademark policy and other project policies please see https://lfprojects.org.